According to a 2017 report on CEO pay from the Economic Policy Institute, chief executives at 350 top companies made $15.6 million on average in 2016—271 times what the typical worker earns. The CEO of Marathon Petroleum, Gary Heminger, took home an astonishing 935 times more pay than his typical employee in 2017.
Even Americans with “good jobs” are overworked and lack first-world working conditions. Any European worker is entitled to a month’s paid vacation in his or her first year of work. How long does it take the average American worker to merit a month’s vacation? Maternity leave in Spain has just been extended by their socialist government to 16 weeks, with an additional five weeks of paternity leave for the father.
Some Inequality Numbers
Most of these statistics are from the Stanford Center on Poverty and Inequality:
Wage Inequality
Over the last 30 years, wage inequality in the United States has increased substantially, with the overall level of inequality now approaching the extreme level that prevailed prior to the Great Depression.
Education Wage Premium
Only college graduates have experienced growth in median weekly earnings since 1979 (in real terms). High school dropouts have, by contrast, seen their real median weekly earnings decline by about 22 percent.
Gender Pay Gaps
Throughout much of the 20th century, the average woman earned about 60% of what the average man earned. Starting in the late 1970s, there was a substantial increase in women’s relative earnings, with women coming to earn about 80% of what men earned.
This historic rise plateaued in 2005 and, since then, the pay gap has remained roughly unchanged.

Women’s pay as a percentage of that of men
Child Poverty
The United States boasts fifth position in the world ranking of the percentage of poor children with 21 percent of its children in poverty,

Health Insurance
In 2007, 8.1 million American children under 18 years old were without health insurance. Children in poverty and Hispanic children were more likely to be uninsured.
Bad Jobs
“Bad jobs” are typically considered those that pay low wages and do not include access to health insurance and pension benefits. As shown here, about 10% of full-time workers are in low-wage jobs, about 30% don’t have health insurance, and about 40% don’t have
pensions. The graph also shows that the likelihood of being in a bad job is much worse for part-time workers, for on-call and day laborers, and for those working for temporary help agencies.
Incarceration
The incarceration rate in the United States has grown so dramatically since the 1970s that the U.S. now has one of the highest rates in the world. The rise in incarceration has been especially prominent among young Black males and high school dropouts. As shown in this graph, a full 37% of those who are both young black males and high school dropouts are now in prison or jail, a rate that’s more than three times higher than what prevailed in 1980.
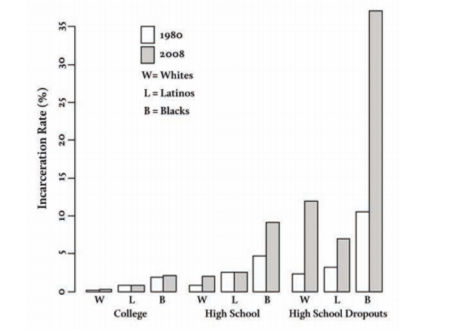
Percent of 20-34-year-old men in prison or jail, by race, ethnicity,
and educational attainment, 1980 and 2008
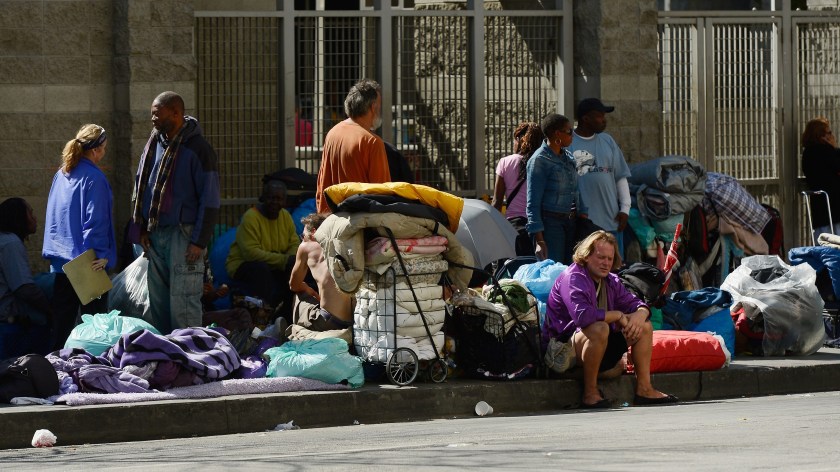
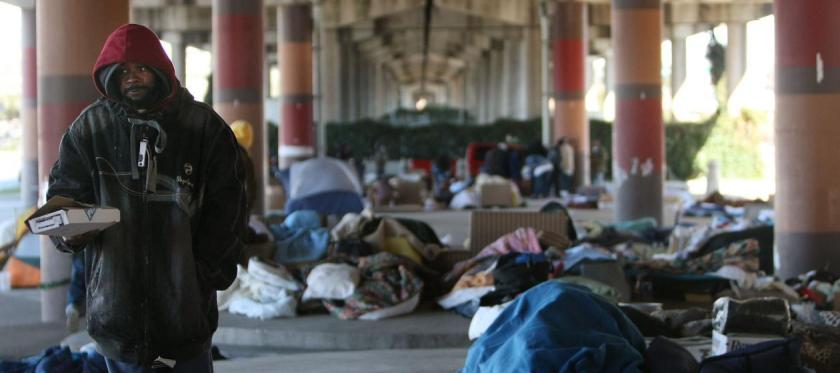
Homelessness is as American as Apple Pie
Scenes of homelessness such as are seen on the streets of the United States today are unthinkable in any other country in the first world.
According to The Week, March 11, 2018, about 554,000 people in the U.S. were homeless on any given night in 2017 — including nearly 58,000 families with children — meaning they didn’t have a safe, permanent place to sleep. That figure represents a 1 percent rise since 2016 — the first time the nation’s homeless population has increased in seven years. But the country’s biggest cities, especially those on the West Coast, have seen a far bigger rise in homelessness. New York City, which has the nation’s largest homeless population, reported a 4 percent increase since 2016 to about 76,500 people, San Diego a 5 percent increase to 9,160, and Los Angeles a 26 percent increase to nearly 55,200.


 American Cemetery and Memorial in homage to the Americans killed in World War I–allegedly because it was going to rain–marked a new low-water mark in President Trump’s trajectory. To have repeated the same gesture on the following Monday, skipping the Veterans’ Day ceremonies at Arlington National Cemetery in Virginia, for the same reason, was equally unseemly for America’s first patriot. He is, after all, an expert on disrespect. Continue reading “Trump and Disrespect, What Went Wrong?”